Implementing a real-time purchase ticker using just Jquery and Google Sheets

Many sites now feature real-time updates on the status of orders, letting you know when somebody else has purchased an item. They can be implemented with the aim of driving urgency and providing social proof, “if other people are purchasing this, then it must be good”.
Whilst consulting at a UK based startup, we proposed testing something similar. The startup, a crowdfunding and trading platform for property, were excited by the opportunity to show investors the activity happening in the marketplace. Like any marketplace, they rely heavily on both buyers and sellers. We hypothesised that showing trading activity would encourage those in either the buyer or seller bucket to trade.
As well as the concept, I had to look at implementing the alerting system — as cheaply as possible, in an MVP fashion. When writing A/B tests, my aim is always to make the code as easy as possible to discard. I don’t want developers, or myself, to become attached to a variation so I always attempt to keep as much code away from the core codebase as possible. This reduces the release cycle, reduces the scope of QA and focuses our efforts on solving the hypothesis.
For this project, there would be 3 challenges. The collection of data, the sorting of data (deciding on what to show, when) and the outputting of the data.
Challenge 1 — Data Collection
Any website which processes transactions, whether they are e-commerce transactions or stock market trades, stores that data, usually in a MySQL database. We didn’t use this data. Doing so would have meant making changes to pre-existing code, and manipulating much more data than we needed.
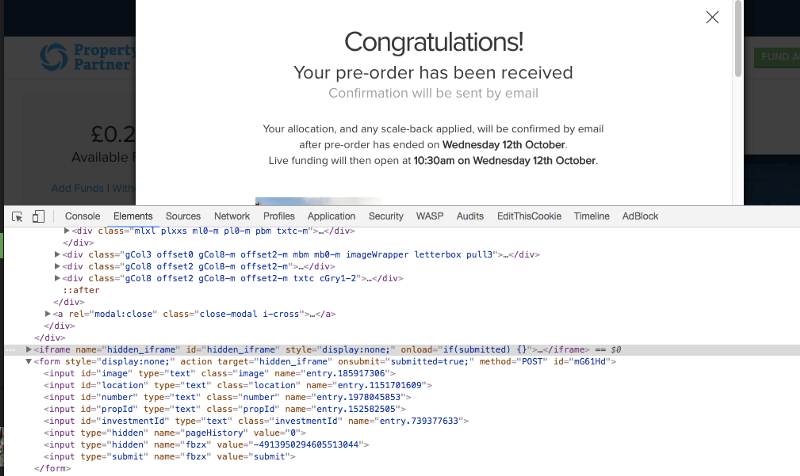
I’ve previously written blogs about my love for Google Forms and Google Sheets, so it will come as no surprise that I looked to this to collect our data. Using Optimizely, I set up a ‘bootstrap’ experiment running to 100% of traffic on the confirmation page. On this confirmation page there was a Google Form, which would collect the data required for each purchase made. Upon reaching the page, we had a hidden form submit which would whisk off to a Google Sheet the timestamp, transaction ID, quantity and property ID (the property which you purchased). This data would be sufficient enough to begin to create our realtime ticker.
To create the form we copied the HTML from a Google Form, and created a hidden submit which submitted a hidden iframe. I’ve redacted the submit action from the above screenshot.
Challenge 2 — Sort data
As users began to complete transactions our spreadsheet of form responses began to fill up. Transaction sizes varied, as did the properties being purchased. We did not want to output every single transaction, as this would mean a huge volume of trades being shown, we opted to be more selective. In ecommerce, for example, you may wish to exclude a certain category of product. And it was at this stage which we excluded trades below a certain threshold.
All the sorting and filtering of data was done within Google Sheets. Why was this great? Anyone in the business could tweak the algorithm at anytime. It was a ready made CMS for the real-time ticker.
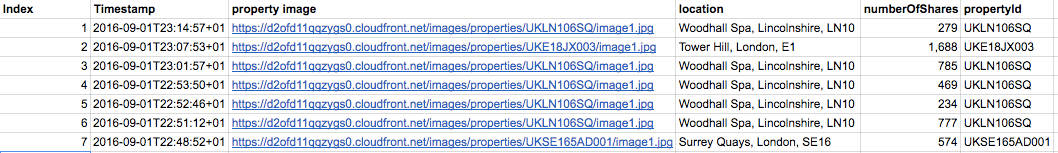
In the same Spreadsheet in which the form data was being collected we created a new sheet. In that new sheet we wrote an advanced Excel formula, which would pull through only the 50 most recent transactions (using the timestamp) with a trade volume (using quantity) greater than X value.
The sorted trades appeared below. To create this view, we simply wrote an Excel formula which set the criteria and it then pulled the appropriate trades from the “Form Responses” sheet.
Challenge 3 — Output the data
To output the data again I used Google Sheets. Why? Google Sheets allows you to create a JSON feed based upon a spreadsheet, meaning I could create a feed of those 50 transactions and I would get the data formatted as required on the front-end.
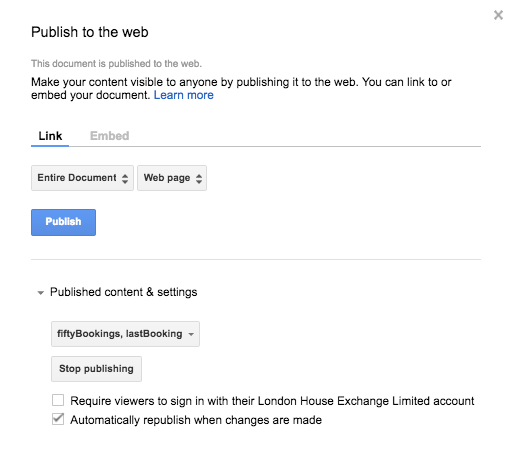
To create the JSON feed in Google Sheets you will need to select “Publish to web” from the File menu. Choose the appropriate sheet which you want to publish, in this case we didn’t want to expose a full trading history (only the last 50) so we only shared this sheet. Once this is done you can retrieve the JSON feed using the following URL, https://spreadsheets.google.com/feeds/list/spreadsheetID/sheetNo/public/values?alt=json
Our Optimizely experiment called the JSON feed, and appended the 50 trades to a section of the page, which had been created within the Optimizely variant.
To create the scrolling effect we used JqueryMarquee, which would rotate through the 50 transactions continuously. To allow interaction with the ticker, so users could view the properties, I set the slider to pause on hover.
I also made used of a Jquery plugin called TimeAgo, which translated the timestamp into a nice “x minutes ago” message, allowing the users to see exactly when a trade was made in an easy to understand fashion.